Peeking into CLR interface method calls
For a while I’ve been looking for an excuse to spend some time reading CoreCLR sources when I realised I don’t know the details of how interface method calls are implemented.
Sasha Goldshtein’s excellent book Pro .Net Performance contains a chapter on .Net object internals and an explanation of interface method dispatch that is good enough for all practical purposes – in the worst case, a call may involve multiple memory accesses to lookup info in several structures, but the runtime attempts to cache the most frequently used implementation and uses heuristics to minimise the number of instructions.
But that’s not enough gory details! Where is the code? So now I have an excuse.
The Book of the Runtime contains a very thorough explanation of the Virtual Stub Dispatch technique and the reasons this implementation was chosen. This post is intended to be a shorter summary, with the addition of links to relevant code, pieces of disassembly and notes on things I found interesting while reading CoreCLR code. Would love to hear feedback if anyone finds this type of blog post useful.
Practical matters
In order to be be able to debug CoreCLR internals, I am using the latest debug build taken from a Jenkins job (a link to newer builds can be found on the CoreCLR github page). Any references to code are to commit 021a224809af2104a1c488da1d717d9d80f35cc8.
The CI build contains correct versions of sos.dll and the DAC, so .cordll -ve -u -l in WinDbg will load them. Since we might want to look at CLR structures as actual C structures (i.e. to do dt CoreClr!MethodTable), we need to add symbols are contained in the debug build to the symbol path: .sympath+ c:\tmp\coreclr\pdb.
I also used the SOSEX extension, mostly for the awesome !muf command, which shows interleaved C#/IL/native code: .load sosex, but I realise that there is no reason it should be compatible with CoreClr. Some commands seem to work, no idea about the rest.
Virtual calls
are surprisingly straightforward, the single interesting detail being that the vtable is organised is chunks of 8 methods to allow parts to be shared, for example between a child type and its’ parent.
base.Foo();
    IL_002a: ldloc.1  (derived2)
      ;load object pointer from a local variable
        mov     rcx,qword ptr [rbp-20h]
        mov     rax,qword ptr [rbp-20h]
        ;dereference object pointer to get the method table
        mov     rax,qword ptr [rax]
        ;access relevant vtable chunk by adding compile-time known offset
        mov     rax,qword ptr [rax+48h]
    IL_002b: callvirt CoreClrApp1.Base::Foo()
        ;call method with known offset in chunk
        ;offset is 20h because first four methods are inherited from Object
        call    qword ptr [rax+20h]
Interface calls
A typical interface call looks like this:
ifoo.Foo();
    IL_002a: ldloc.1  (derived2)
        mov     rcx,qword ptr [rbp-20h]
        mov r11,7FE885A0028h
        cmp     dword ptr [rcx],ecx
    IL_002b: callvirt CoreClrApp1.Ifoo::Foo()
        call    qword ptr [r11]
mov r11,7FE885A0028h
Here we load the address of an indirection cell – a pointer-sized value which stores the address of some code that will do all the magic.
cmp dword ptr [rcx],ecx
Interestingly enough, this actually is a null check (Dereferencing a null pointer will cause an access violation that the runtime will turn into a NullReferenceException. For virtual calls, we dereference the object pointer anyway to get the method table, so an explicit check is not needed. The code that determines if an explicit check needs to be emitted can be found in CEEInfo::getCallInfo).
call qword ptr [r11]
Finally, call the address stored in the cell.
When the JIT compiler processes an interface method call, it calls VirtualCallStubManager::GetCallStub, which returns a pointer to a stub, then allocates an indirection cell by calling VirtualCallStubManager::GenerateStubIndirection and sets its’ value to the address of the stub. The address of the indirection cell remains a constant in the instruction sequence, but the value it points to can change over time to point to one of three kinds of stubs:
- Initially, call sites point to a Lookup stub, which simply calls the runtime resolve logic with a
DispatchToken(a DispatchToken is a tuple of (global interface id, interface method id) that identifies a particular interface method). -
Dispatch stubs serve call sites where the implementation type is usually the same (monomorphic call sites). A Dispatch stub caches the target method address for a particular expected method table value. If the actual method table matches the expected value, it calls the method. This is the fastest possible path and the instruction sequence in this case looks like this:
mov rax, <expected MethodTable> cmp qword ptr [rcx],rax jne ResolveStub.FailEntry mov rax, <implementation address> jmp rax - Resolve stub contains two entry points
- ResolveEntry looks up the implementation in a cache by a key consisting of (DispatchToken, method table of actual ‘this’ pointer) and transfers control to the result or performs a runtime lookup. Part of the key that depends on the dispatchToken is prehashed and stored in the stub to reduce overhead.
- FailEntry is where a failing dispatch stub transfer control if the method table comparison fails. This decrements a counter and transfers control to ResolveEntry or, if the counter reaches zero, to a function that will patch the indirection cell to point to a resolve stub.
Stubs are implemented in assembly, but are also accessed as structs from code, so are actually written by initialising struct fields to assembly opcodes from C++ and according to comments in the code, are optimised for things like branch prediction. Very hardcore! The AMD x64 implementation is in src/vm/amd64/virtualcallstubcpu.hpp.
The entry point for the runtime lookup logic is the global function VSD_ResolveWorker, which is called with a DispatchToken and the method table of the target object. From there we call:
VirtualCallStubManager::ResolveWorkertries to lookup a cached stub. If the cache lookup fails, it callsResolverto perform the lookup. After acquiring a target address, it creates a stub and caches it.VirtualCallStubManager::Resolvercontains some logic related to transparent proxies and determines if the call site should be patched after returning.- After a bit of delegation (
Resolver->MethodTable::FindDispatchSlot->FindDispatchImpl->FindDispatchEntry->FindDispatchEntryForCurrentType) we get to:
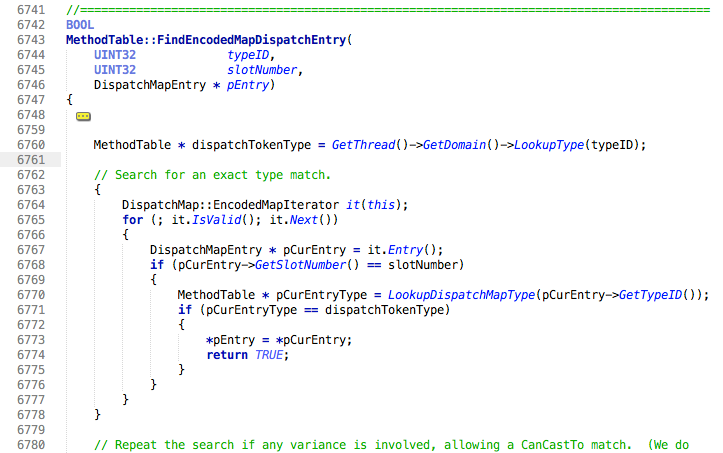
Here, we use an appdomain-level map (TypeIdMap) to lookup the target interface method table by its’ DispatchToken id and perform a linear search over a part of the methodtable called the DispatchMap which is an encoded list of (per-implementation interface id, DispatchToken method id, target slot number) tuples to find the target vtable slot number. After determining the slot number, we look it up in the vtable of the current class or one of its’ base classes.
Done!
Bits and pieces
-
When looking at diagrams of .net object layout I did not pay attention to the fact that object references actually point to the method table pointer, and not to the start of the object. After looking at instructions generated for a virtual method call it seems probable that this is an optimisation - to save a +(sizeof(WORD)) instruction. Begs the question - why is the method table pointer not located at offset 0 from start?
-
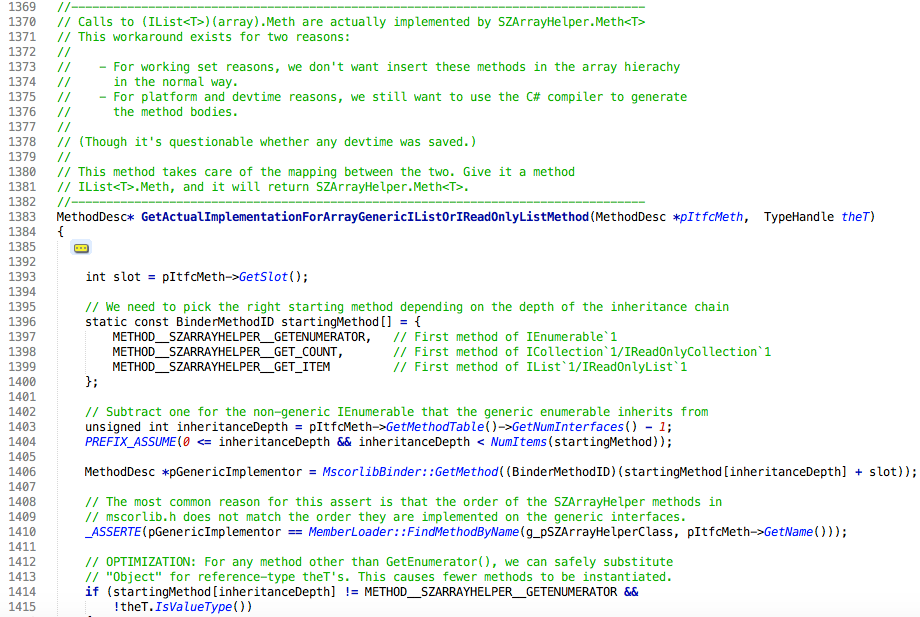
The virtual stub dispatch logic contains an interesting optimisation (huge hack?) for interface calls on arrays. Specifically, arrays do not implement any generic interfaces; calls of
IEnumerable<T>,IList<T>(and other) methods on arrays are handled by looking up the corresponding method by index onSZArrayHelper<T>. This saves creating a methodtable for each of these interfaces (5 total) for every T. Additionally, calls on reference type arrays can even useSZArrayHelper<object>, saving anSZArrayHelper<T>methodTable for every T.
- I have mixed feelings about theCoreCLR code base. I really want to like it because I was pleasantly surprised that having zero experience writing C++, I was able read and understand most of the code I encountered. I also like that the code contains lots of very good comments explaining why the code is written the way it is, explaining design decisions, reasons for implementing an optimisation (or not), etc. For example:
- reason for choosing to organise the VTABLE in 8-method chunks
- the core Virtual Stub Dispatch logic
- how managed threads are suspended for a GC.
This kind of comments is something that I think is unfortunately missing from our project’s sources and is something that I would like to see around some of the less trivial code or more hardcode optimisations.
On the other hand, I can’t imagine maintaining something similar. Methods containing 500 to 1000 lines of code are fairly common.
ResolveWorkeris about 400 lines and does a LOT of different things: tries to lookup a stub in one of two caches, calls the runtime resolve logic, updates caches, patches the call site… Simply stepping into a call from a method of this size leaves me lost when I navigate back - which part of the method am I reading? Why not extract some methods?var result = LookupCached(token, methodTable); if (result == null) { result = Resolve(token, methodTable); Cache(token, methodTable, result) } if (NeedToPatch(callSite)) Patch(callSite, result); return result;MethodTableBuilder::InitializeFieldDescsis 800 lines and uses agoto:statement inside a foreach loop to repeat most of the loop body for the current element. How hardcore does one have to be to modify any of this method and have any degree of certainty that all of the 10 or so local variables that are mutated all over the place will be in an acceptable state when the code after the goto is executed?
That was fun! I don’t yet see a use for knowing the exact implementation details of interface method dispatch, our code is very far from being that performance sensitive. But the experience of reading CoreCLR code was interesting and I feel much less intimidated by large C++ code bases now.